Data Centre Monitoring with IoT: Power, Cooling, and PUE Optimisation
06 October 2026
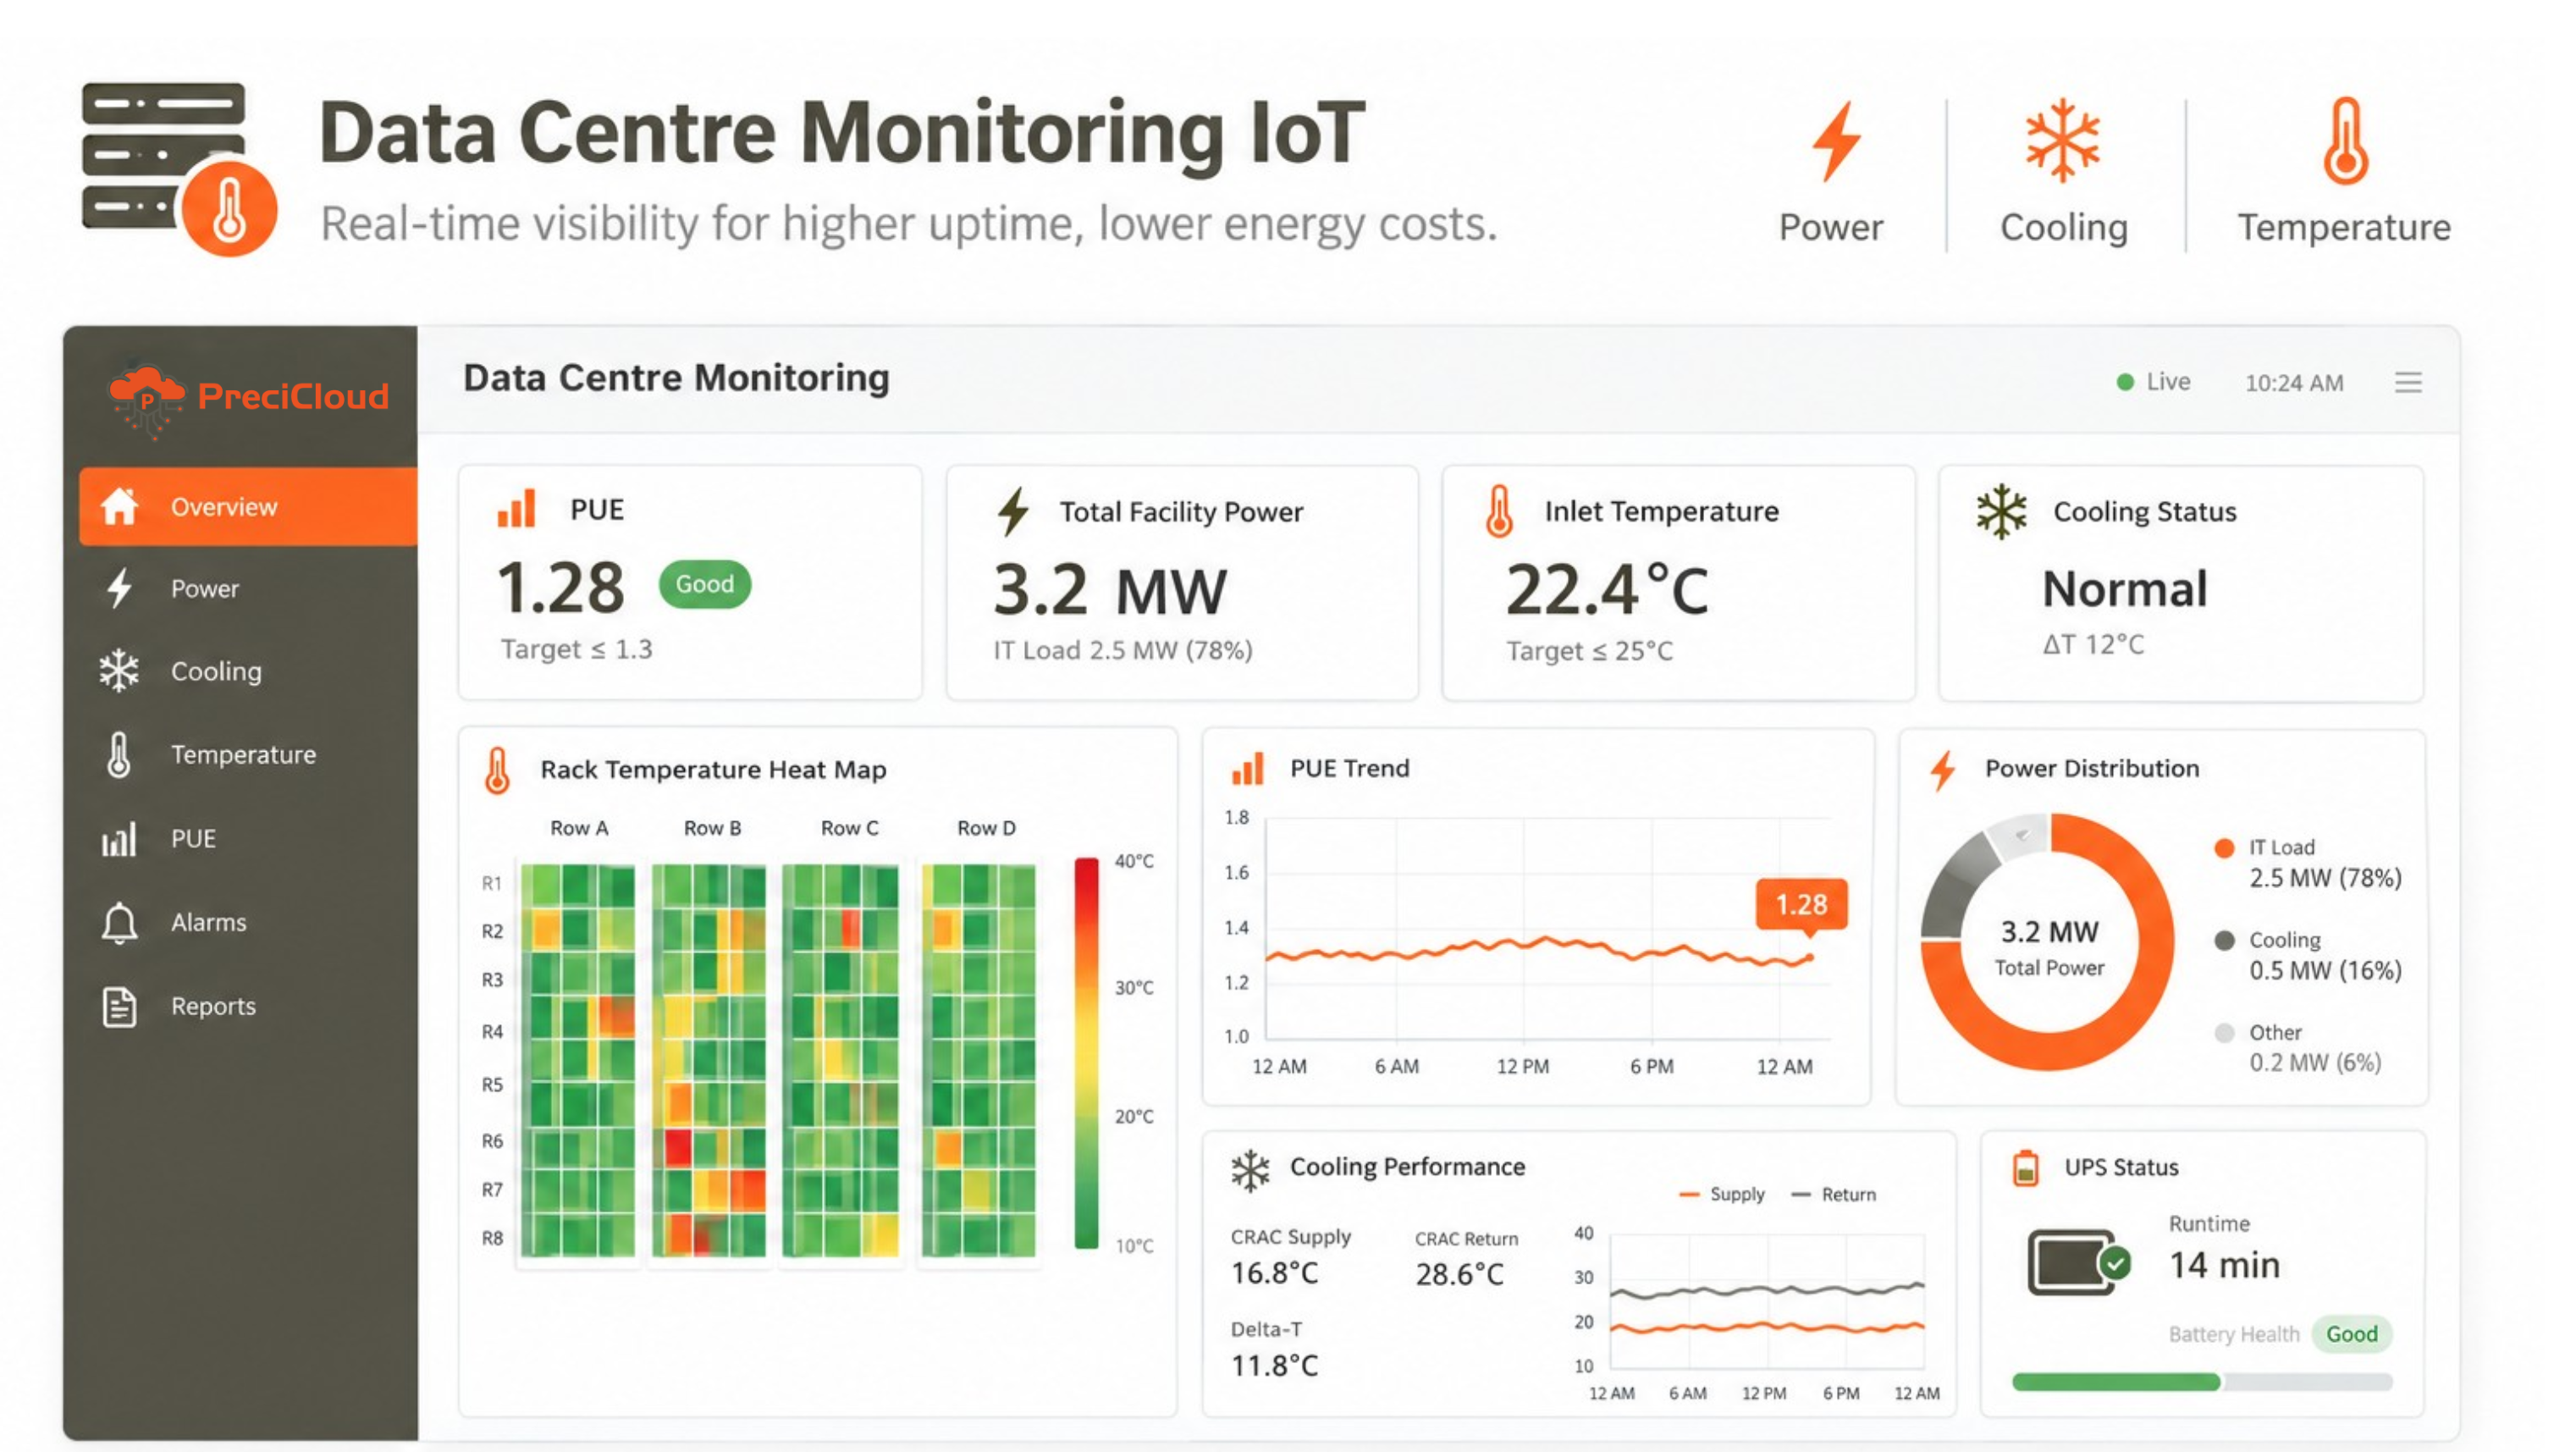
Data centre monitoring IoT provides the real-time power, cooling, and environmental visibility that data centre operators, facility managers, and IT infrastructure teams need to prevent the thermal shutdowns, power failures, and cooling inefficiencies that threaten uptime and inflate energy costs. Data centres are among the most energy-intensive and uptime-critical facilities in the modern economy — a medium enterprise data centre might consume 1–5 MW of electricity continuously, with cooling accounting for 30–50% of that total, and any failure of power or cooling that causes server shutdown can result in millions of dollars of lost business continuity. Yet despite this critical nature, many enterprise data centres lack granular data centre power monitoring at the rack and row level, relying instead on facility-level utility metering that cannot distinguish IT equipment power from cooling overhead — making PUE improvement and hotspot identification impossible without PUE monitoring data centre IoT sub-metering. Server room temperature monitoring with IoT wireless sensors placed at rack inlet height across every row transforms thermal management from reactive emergency (discovering a hot spot when a server alarms) to proactive (detecting cooling drift days before it reaches server inlet temperature limits). Data centre cooling IoT monitoring of CRAC/CRAH units, chilled water temperatures, and economiser operation enables the continuous optimisation of cooling setpoints that separates a 1.5 PUE data centre from a 1.2 PUE facility — a difference that translates directly to millions of rupees in annual electricity cost for a facility of meaningful scale.
Critical Monitoring Parameters for Data Centres
- Server Room Temperature Monitoring: ASHRAE A1-class server equipment requires ≤25°C inlet air; A2-class tolerates ≤35°C. Server room temperature monitoring with IoT sensors at rack inlet height (not just room ambient) identifies hot spots from hot aisle bypass, blanking panel gaps, and CRAC underperformance — detecting them before they reach server thermal throttling thresholds. Temperature logging from data centre monitoring IoT also provides the thermal history record required for Uptime Institute tier certification audits.
- Data Centre Power Monitoring (PDU and Rack Level): Total facility data centre power monitoring from utility sub-metering combined with IT equipment power from intelligent PDUs or branch circuit monitors enables continuous live PUE calculation. Rack-level power monitoring identifies densifying racks approaching their power circuit limits, preventing overload trips from high-density compute deployments and enabling capacity planning. PUE monitoring data centre trend analysis identifies when cooling-to-IT power ratio deteriorates — signalling cooling optimisation opportunity.
- Data Centre Cooling IoT — CRAC/CRAH Performance: CRAC supply air temperature, return air temperature, and delta-T across the unit indicate cooling capacity versus current load. Data centre cooling IoT monitoring detects CRAC filter clogging (rising supply air temperature at constant load), refrigerant charge degradation (reduced delta-T), and fan performance reduction — all before they impact server inlet temperatures. Chilled water supply and return temperature monitoring from the chiller plant also enables data centre cooling IoT PUE impact analysis.
- Water and Leak Detection: Water ingress under raised floors or from cooling unit condensate drainage is a major data centre risk. Data centre monitoring IoT water detection sensors on raised floor panels beneath cooling units, pipe runs, and UPS battery areas provide immediate alerts on water presence — enabling response before water reaches active equipment or UPS batteries.
Data Centre Monitoring IoT: Key Metrics and Benchmarks
| Metric | Data Centre Monitoring IoT Data Source | Target / Benchmark |
|---|---|---|
| PUE (Power Usage Effectiveness) | PUE monitoring data centre — facility power ÷ IT power | Best practice ≤1.3; industry average 1.5–1.6 |
| Rack Inlet Temperature | Server room temperature monitoring IoT at each rack | ≤25°C (ASHRAE A1); ≤35°C (A2) — alert at >22°C / >30°C |
| CRAC Return Air Delta-T | Data centre cooling IoT — supply vs. return temp differential | 10–15°C delta-T target; <8°C indicates airflow bypass inefficiency |
| Rack Power Utilisation | Data centre power monitoring — actual kW vs. provisioned capacity | Target 80–85% utilisation; >90% requires immediate capacity management |
| UPS Runtime | Data centre monitoring IoT — battery state, discharge test records | ≥10 min at full load; declining runtime triggers battery replacement |
Deploy Data Centre Monitoring IoT with Precisol Automation
Precisol Automation's Wireless Temperature Sensor provides battery-powered rack inlet temperature monitoring for server room temperature monitoring across all rows without cabling through raised floor or ceiling structures — simplifying deployment in live data centres where cable routing is restricted. The PreciCloud IoT Cloud Dashboard hosts the data centre monitoring IoT platform with rack temperature heat maps, PUE monitoring data centre live calculation, data centre cooling IoT trend analysis, and data centre power monitoring dashboards.
See wireless temperature monitoring at scale in our warehouse temperature monitoring case study, or explore data centre temperature monitoring for deployment guidance on server room temperature monitoring with Precisol wireless sensors.
Frequently Asked Questions
What does data centre monitoring IoT measure?
Data centre monitoring IoT measures server room temperature at rack inlet (ASHRAE compliance), humidity, rack and PDU power (data centre power monitoring), CRAC/CRAH supply and return temperature (data centre cooling IoT), chilled water temperatures, PUE (facility power ÷ IT power from PUE monitoring data centre sub-metering), UPS and generator status, water leak detection, and airflow. Together these enable thermal management, PUE optimisation, and uptime assurance for critical data centre infrastructure.
What is PUE monitoring in a data centre and why does it matter?
PUE monitoring data centre calculates total facility power divided by IT equipment power — the primary data centre energy efficiency metric. Industry average PUE is 1.5–1.6; efficient facilities achieve 1.2–1.3. Data centre monitoring IoT continuously calculates live PUE from facility metering and PDU-level IT power — enabling specific PUE optimisation by identifying cooling overhead, hot aisle containment losses, and data centre cooling IoT inefficiencies that drive PUE above target values.
How does server room temperature monitoring IoT prevent server thermal shutdown?
Server room temperature monitoring IoT places sensors at rack inlet height across every row — detecting hot spots from cooling failures, containment breaches, and blanking panel gaps before they reach ASHRAE A1 (≤25°C) or A2 (≤35°C) limits. Data centre monitoring IoT alerts enable operational response (adding blanking panels, redistributing load) before thermal throttling or server shutdown. Data centre cooling IoT trend monitoring also detects CRAC performance degradation days before it manifests as rising server inlet temperatures.