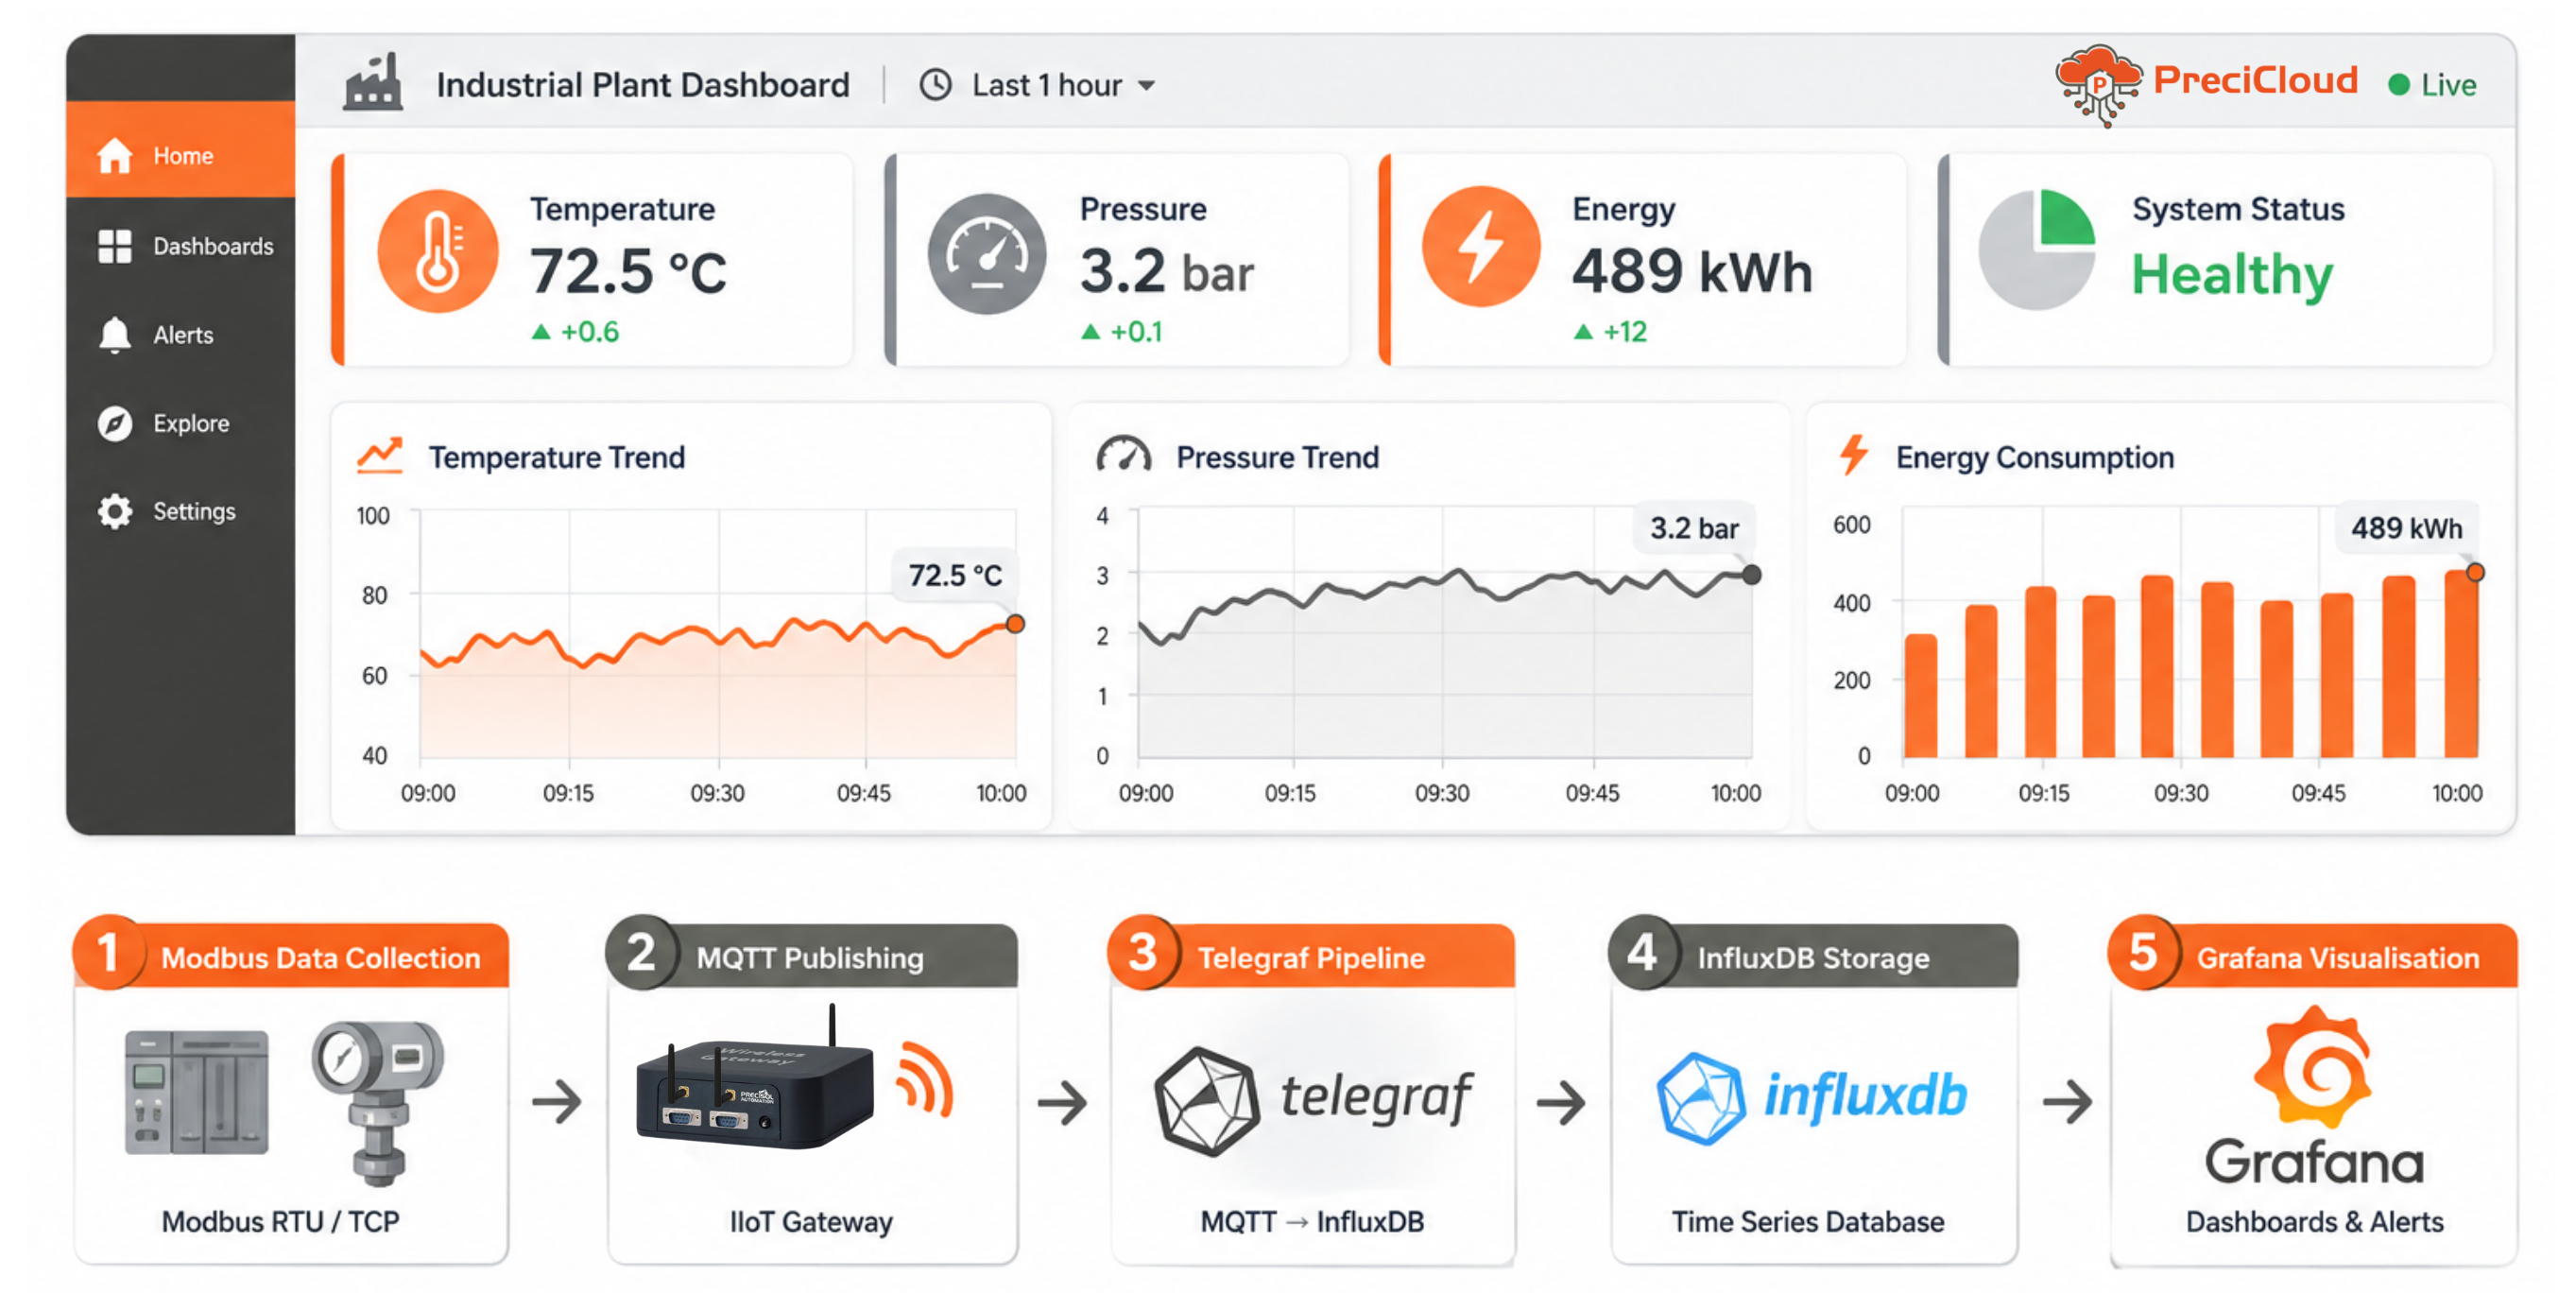
Grafana industrial IoT dashboard has become the de-facto visualisation layer for IIoT sensor monitoring in industrial facilities — a free, open-source platform that connects to virtually any time series database (InfluxDB, TimescaleDB, Prometheus, PostgreSQL) and renders real-time and historical sensor data in configurable dashboard panels with built-in alerting. Where commercial SCADA systems charge per-tag licence fees that can reach tens of thousands of dollars for large tag counts, a Grafana IIoT sensor monitoring setup combining open-source Grafana + InfluxDB (or TimescaleDB) + Mosquitto MQTT broker + Telegraf runs on a single server at zero software licence cost, handling tens of thousands of sensor tags without per-point pricing. The result has been widespread adoption of Grafana as the visualisation layer for IIoT deployments where the primary need is trend monitoring, energy dashboards, and predictive maintenance indicator displays — complementing (rather than replacing) hard-SCADA systems for control and alarming. Industrial IoT dashboard setup with Grafana is accessible to engineers without dedicated software development skills: the web-based dashboard editor supports drag-and-drop panel configuration, the Flux or SQL query builder has guided UI, and thousands of pre-built community dashboards are available on Grafana.com for common industrial monitoring scenarios (energy monitoring, Modbus PLC data, temperature and humidity, OEE). This guide covers the complete Grafana Modbus data visualisation pipeline from field Modbus device to Grafana dashboard panel, the best panel types for industrial use cases, and how to configure Grafana InfluxDB IIoT alerts for threshold-based monitoring.
Grafana Industrial IoT Dashboard: Data Pipeline Setup
- Step 1 — Modbus Data Collection and MQTT Publishing: Grafana Modbus data visualisation starts with the IIoT gateway collecting Modbus RTU or Modbus TCP register data from PLCs, transmitters, and energy meters and publishing to an MQTT broker. The gateway configuration specifies the Modbus device address, register addresses, data types (UINT16, INT16, FLOAT32), and scaling factors for each measurement point. The IIoT gateway publishes JSON payloads to topic paths (e.g., plant/area/equipment/tag) at configured polling intervals (30 seconds to 5 minutes typical). The MQTT broker (Mosquitto, HiveMQ, or cloud-hosted AWS IoT Core) receives all gateway data streams as the central message bus for the Grafana industrial IoT dashboard pipeline.
- Step 2 — Telegraf MQTT to InfluxDB Pipeline: Telegraf agent (installed on the server running InfluxDB) subscribes to all MQTT topics using the mqtt_consumer input plugin and writes to InfluxDB using the influxdb_v2 output plugin. Telegraf parses the JSON MQTT payload, maps JSON fields to InfluxDB field names, and adds the gateway/topic path elements as InfluxDB tags (enabling efficient filtering by site, equipment, or tag name in Grafana InfluxDB IIoT queries). Telegraf handles batching, buffering, and retry on database write failure — ensuring no data loss when the InfluxDB server is temporarily unavailable. This Telegraf stage is the key enabler for Grafana IIoT sensor monitoring without writing custom code.
- Step 3 — InfluxDB Retention and Aggregation: InfluxDB buckets are configured with retention policies matching the data value lifetime — raw sensor data retained for 30–90 days; hourly aggregates for 1–2 years; daily summaries indefinitely. InfluxDB tasks (Flux scripts scheduled on InfluxDB) run every hour to downsample raw data into the aggregate bucket. This tiered Grafana InfluxDB IIoT storage strategy keeps query performance fast on long-range historical queries (Grafana automatically queries the appropriate resolution bucket via Flux).
- Step 4 — Grafana Dashboard Configuration: Industrial IoT dashboard setup in Grafana: add the InfluxDB data source (URL, organisation, bucket, API token); create a new dashboard; add time series panels with Flux queries selecting the relevant measurement and tag filters; configure panel thresholds (yellow at warning, red at alarm); set panel refresh interval (5–30 seconds for live process monitoring); add gauge panels for current value display; and configure Grafana alert rules that fire when a Flux query returns a value exceeding the threshold — sending notifications via email, PagerDuty, or Slack. The Grafana industrial IoT dashboard is now live and accessible via browser on any device on the plant network or cloud, without dedicated client software.
Industrial IoT Dashboard Setup: Grafana Panel Types
| Panel Type | Grafana IIoT Sensor Monitoring Use Case | Best For |
|---|---|---|
| Time Series | Temperature, pressure, energy trends over time | Process trend analysis, shift comparison — Grafana InfluxDB IIoT |
| Gauge | Current sensor value with threshold colouring | Plant overview page — current status of all critical parameters |
| Stat | KPI value with trend arrow (today's kWh, shift production) | Management dashboard — energy and production KPIs |
| Alert List | Active Grafana alerts from all panels | Operations screen — active alarms from Grafana industrial IoT dashboard |
Grafana Industrial IoT Dashboard with Precisol Automation
Precisol Automation's Serial IIoT Gateway publishes Modbus sensor data via MQTT TLS — feeding directly into the standard Telegraf → Grafana InfluxDB IIoT pipeline for Grafana industrial IoT dashboard setup without any custom data bridge code. The PreciCloud IoT Cloud Dashboard provides a managed cloud alternative to self-hosted Grafana, with pre-built industrial IoT dashboard setup templates for energy monitoring, predictive maintenance, and process parameter trending.
See IoT data integration in our IT-OT bridge for process automation case study, or explore smart energy metering for the Grafana Modbus data visualisation pipeline applied to energy monitoring dashboards.
Frequently Asked Questions
How do you set up a Grafana industrial IoT dashboard for Modbus sensor data?
Grafana industrial IoT dashboard setup for Modbus data: IIoT gateway polls Modbus registers and publishes MQTT JSON to Mosquitto broker → Telegraf subscribes to MQTT and writes to InfluxDB → Grafana connects to InfluxDB via Flux data source → create time series and gauge panels with Flux queries filtering by equipment tag. Grafana IIoT sensor monitoring alerts fire when values exceed thresholds, sending notifications via email or Slack. The full Grafana Modbus data visualisation pipeline from field sensor to live dashboard can be operational in under 2 hours on a single Linux server.
What are the best Grafana panels for industrial IoT dashboard setup?
Industrial IoT dashboard setup in Grafana uses: time series panels for process trend analysis (temperature, pressure, energy over time); gauge panels for current sensor value with threshold colouring (green/yellow/red); stat panels for shift KPIs (total kWh, production count, uptime %); alert list panels for active alarms from all Grafana InfluxDB IIoT alert rules; and table panels for fleet status showing all equipment in one view. Grafana IIoT sensor monitoring dashboards combine these panels on a single screen for operations teams without switching between multiple systems.
How do you connect Grafana to Modbus PLC data directly without InfluxDB?
Grafana Modbus data visualisation without InfluxDB is possible via plugins (Infinity plugin querying a REST API, or a custom JSON backend reading Modbus) but provides only real-time display — no historical trends, no alert evaluation on history. Industrial IoT dashboard setup for production use always includes a time series database (InfluxDB or TimescaleDB) as the storage layer, because Grafana IIoT sensor monitoring's main value is trend analysis and pattern detection over hours and days — which requires stored historical sensor data, not just live values.