Choosing the right time series database IIoT is one of the most consequential architectural decisions in building an industrial IoT data platform — a poor choice either limits scalability as sensor counts and data rates grow, creates query performance problems that make real-time dashboards unusable, or results in storage costs that make long-term trend retention economically impractical. The reason a time series database IIoT is needed at all — rather than the relational databases that most engineers already know — is the specific pattern of industrial IoT sensor data: millions to billions of timestamped readings per day written sequentially, queried almost exclusively by time range, needing efficient downsampling for trend visualisation and automatic purging of old raw data while retaining aggregates. Standard relational databases (MySQL, PostgreSQL without time series extension) were not designed for this write pattern and degrade significantly in performance as IoT sensor tables grow beyond tens of millions of rows — a threshold a 100-sensor IIoT deployment reaches within weeks of deployment. InfluxDB industrial IoT is the most widely deployed dedicated time series database for IIoT, with native integration with Telegraf agent (supporting Modbus, MQTT, OPC-UA as input plugins), line protocol ingestion API, and Grafana as the standard visualisation layer. TimescaleDB IIoT sensor data extends PostgreSQL with time series hypertables that provide comparable performance to InfluxDB while maintaining full SQL compatibility — crucial for IIoT deployments that need to join sensor data with relational tables (asset registry, work orders, quality records) in complex queries. This IIoT database comparison guide covers the technical differences, when to use each, and how to architect the complete IoT time series data storage pipeline from field sensor to dashboard.
Time Series Database IIoT: Architecture Comparison
- InfluxDB Industrial IoT — Purpose-Built TSDB: InfluxDB industrial IoT stores data in measurements (similar to table) with tags (indexed metadata: site, equipment, sensor type) and fields (unindexed numeric values: temperature reading, pressure value). The Line Protocol format (one line per data point) enables high-throughput batch writes from MQTT subscribers. Telegraf with the Modbus input plugin reads registers from PLCs and writes directly to InfluxDB industrial IoT — a complete field-to-database pipeline without custom code. Retention policies automatically delete raw data after 30 days while continuous queries (InfluxDB OSS) or tasks (InfluxDB 2.x Flux) downsample to hourly aggregates retained for 2 years. InfluxDB industrial IoT is the fastest setup for pure sensor telemetry pipelines.
- TimescaleDB IIoT Sensor Data — PostgreSQL Extended: TimescaleDB IIoT sensor data converts a regular PostgreSQL table into a hypertable partitioned by time chunks — automatically managing the partitioning that makes time-range queries fast even with billions of rows. Full SQL with window functions, JOIN to asset metadata tables, and standard PostgreSQL tools (pgAdmin, DBeaver, any SQLAlchemy ORM) work unchanged. Continuous aggregates in TimescaleDB IIoT sensor data materialise pre-computed hourly or daily summaries, refreshed automatically as new data arrives. The IIoT database comparison advantage of TimescaleDB over InfluxDB is SQL — joining sensor readings with production order tables, equipment maintenance history, or quality inspection records in a single query is straightforward in SQL and awkward in Flux.
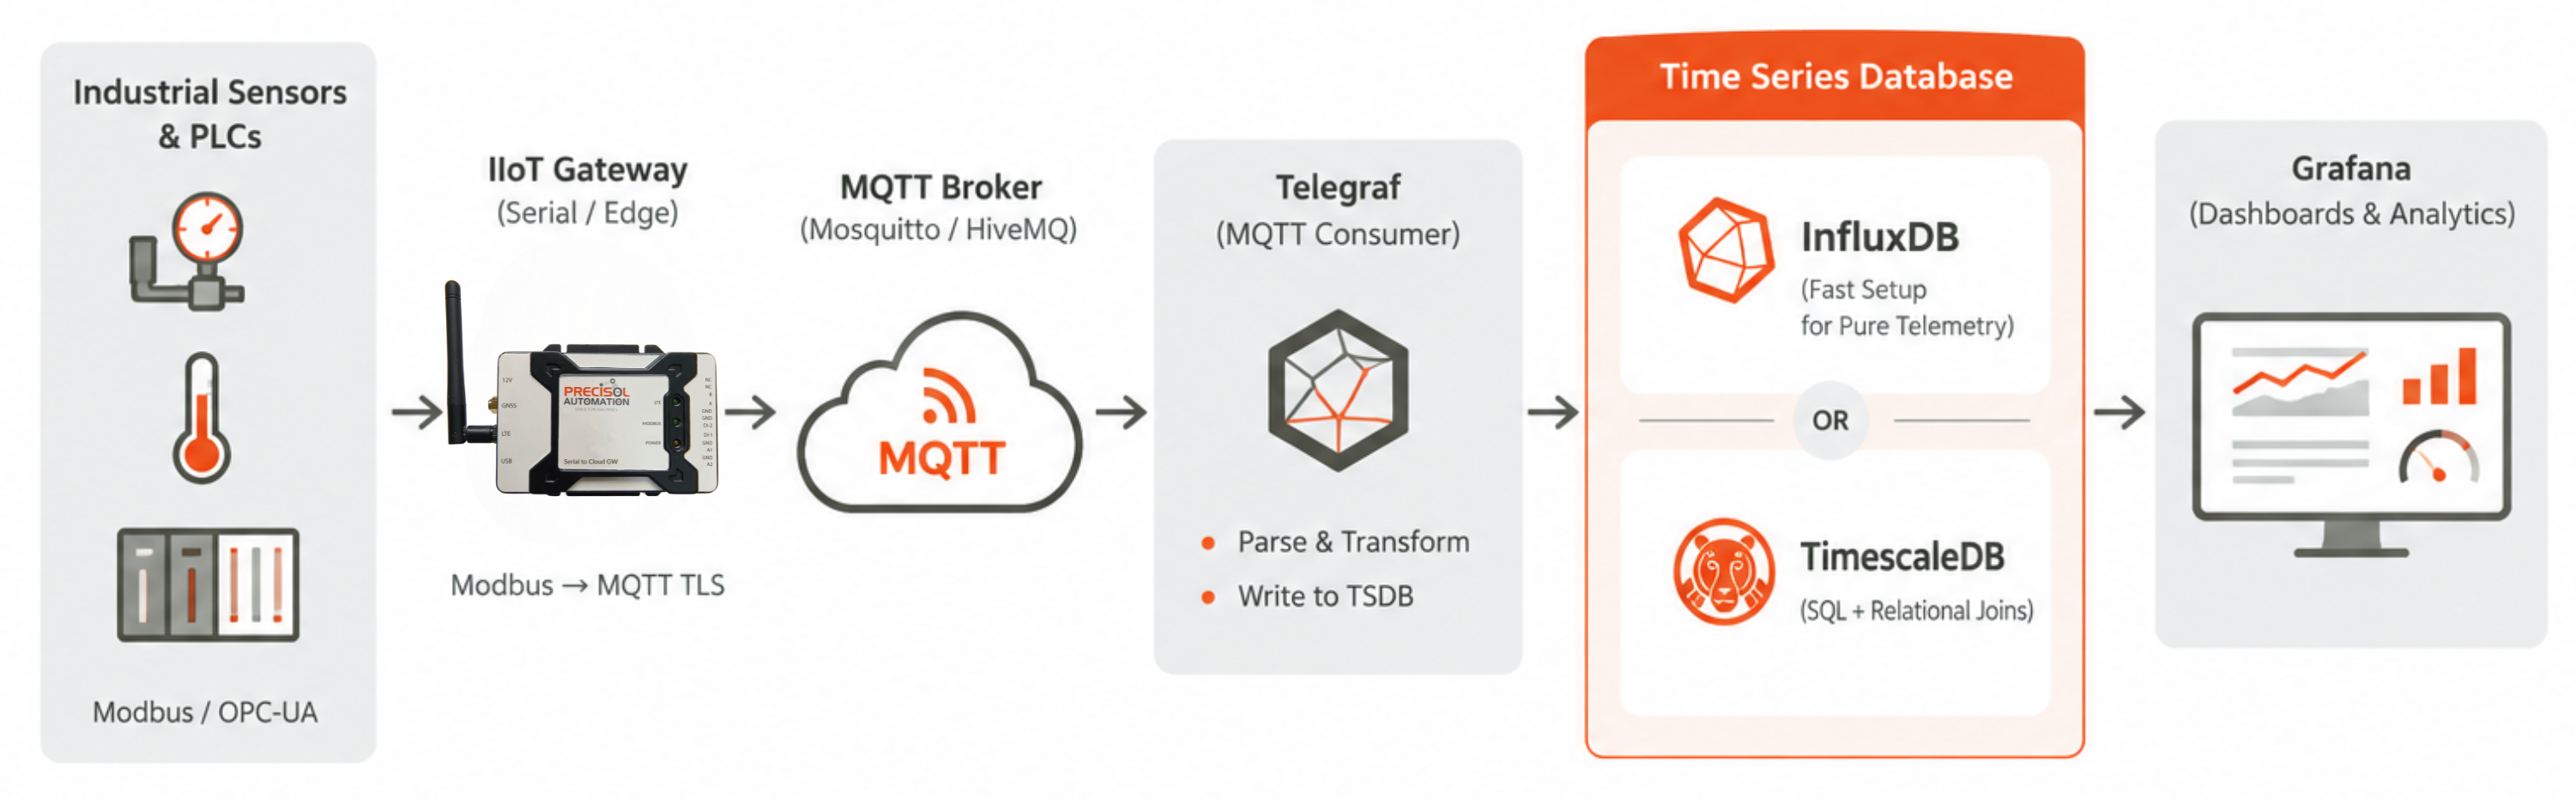
- IoT Time Series Data Storage — Ingestion Pipeline: The standard IoT time series data storage pipeline for Modbus-based IIoT: IIoT Gateway → MQTT broker (Mosquitto/HiveMQ) → Telegraf subscriber or Node-RED flow → InfluxDB industrial IoT or TimescaleDB IIoT sensor data. Telegraf supports direct Modbus TCP/RTU input (polling configurable registers at defined intervals) and outputs to InfluxDB, TimescaleDB (via PostgreSQL output), or both simultaneously for IIoT database comparison evaluation. Data rates: 100 sensors × 1-minute interval = 144,000 points/day; 1000 sensors × 10-second interval = 8.64 million points/day — both well within the capacity of a single time series database IIoT node on modest server hardware.
- IIoT Database Comparison — Which to Choose: Use InfluxDB industrial IoT when: the primary use case is real-time Grafana dashboards of sensor telemetry; the data model is flat (no complex relational joins needed); the team is new to time series and wants fast setup via Telegraf. Use TimescaleDB IIoT sensor data when: existing PostgreSQL infrastructure or team SQL expertise exists; sensor data needs to be joined with relational tables (work orders, quality records, production schedules); or advanced SQL analytics (window functions, CTEs) are required for reporting. Both are free open-source and both integrate natively with Grafana — the IIoT database comparison is fundamentally about SQL familiarity vs. write-optimised simplicity.
IIoT Database Comparison: InfluxDB vs TimescaleDB
| Criteria | InfluxDB Industrial IoT | TimescaleDB IIoT Sensor Data |
|---|---|---|
| Query Language | Flux (functional) / InfluxQL (SQL-like) | Full PostgreSQL SQL |
| Write Throughput | Very high (Line Protocol batch writes) | High (PostgreSQL COPY, batched INSERT) |
| SQL Joins | Limited (Flux task-based) | Full SQL JOINs to relational tables |
| Retention Policy | Built-in retention + continuous aggregates | Continuous aggregates + data tiering |
| Grafana Integration | Native InfluxDB data source | PostgreSQL data source |
| Best For (IIoT Database Comparison) | Pure sensor telemetry pipeline, fast setup | Complex analytics, existing PostgreSQL teams |
Time Series Database IIoT with Precisol Automation
Precisol Automation's Serial IIoT Gateway publishes Modbus sensor data via MQTT TLS — feeding the standard time series database IIoT ingestion pipeline (Telegraf MQTT consumer → InfluxDB industrial IoT or TimescaleDB IIoT sensor data) with no custom code. The PreciCloud IoT Cloud Dashboard provides a managed IoT time series data storage backend with configurable retention and Grafana-compatible APIs for customers who prefer a cloud-managed time series solution over self-hosted deployment.
See process data integration in our IT-OT bridge for process automation case study, or explore smart energy metering for the Modbus-to-MQTT-to-TSDB data pipeline that powers energy monitoring dashboards.
Frequently Asked Questions
What is a time series database and why is it used for IIoT sensor data?
A time series database IIoT is optimised for storing timestamp-indexed measurements — the native structure of IoT sensor data. It outperforms relational databases for IIoT because: it handles high write throughput (millions of rows/day) with minimal index overhead; it compresses numeric time series 5–15x with delta-of-delta encoding; it accelerates time-range and downsampling queries via time-partitioned storage; and it enforces automatic data retention policies that purge raw IoT time series data storage after defined periods while retaining aggregates. InfluxDB industrial IoT and TimescaleDB IIoT sensor data are the two leading open-source options.
What is the difference between InfluxDB and TimescaleDB for industrial IoT?
IIoT database comparison: InfluxDB industrial IoT is a purpose-built time series database with Flux query language, native Telegraf integration for Modbus/MQTT/OPC-UA input, and very high write throughput — best for pure sensor telemetry pipelines with Grafana dashboards. TimescaleDB IIoT sensor data extends PostgreSQL with hypertables — providing time series performance with full SQL compatibility, enabling JOINs with asset metadata, work orders, and quality records. Choose InfluxDB for simplicity and raw throughput; choose TimescaleDB for complex analytics and SQL team familiarity.
How do you architect IoT time series data storage for an industrial IIoT system?
IoT time series data storage architecture: IIoT gateway (Modbus collector) → MQTT broker (Mosquitto/HiveMQ) → Telegraf or Node-RED subscriber → InfluxDB industrial IoT or TimescaleDB IIoT sensor data. Retention policies keep raw data for 30–90 days; continuous aggregates retain hourly/daily summaries for 1–3 years. Grafana connects to either database via native data source for real-time dashboards and historical analysis. 100 sensors at 1-minute intervals generate 144,000 rows/day — comfortably handled on modest server hardware with either time series database IIoT option.