Industrial Sub-Metering IoT: Circuit-Level Energy Monitoring and Cost Allocation
18 September 2026
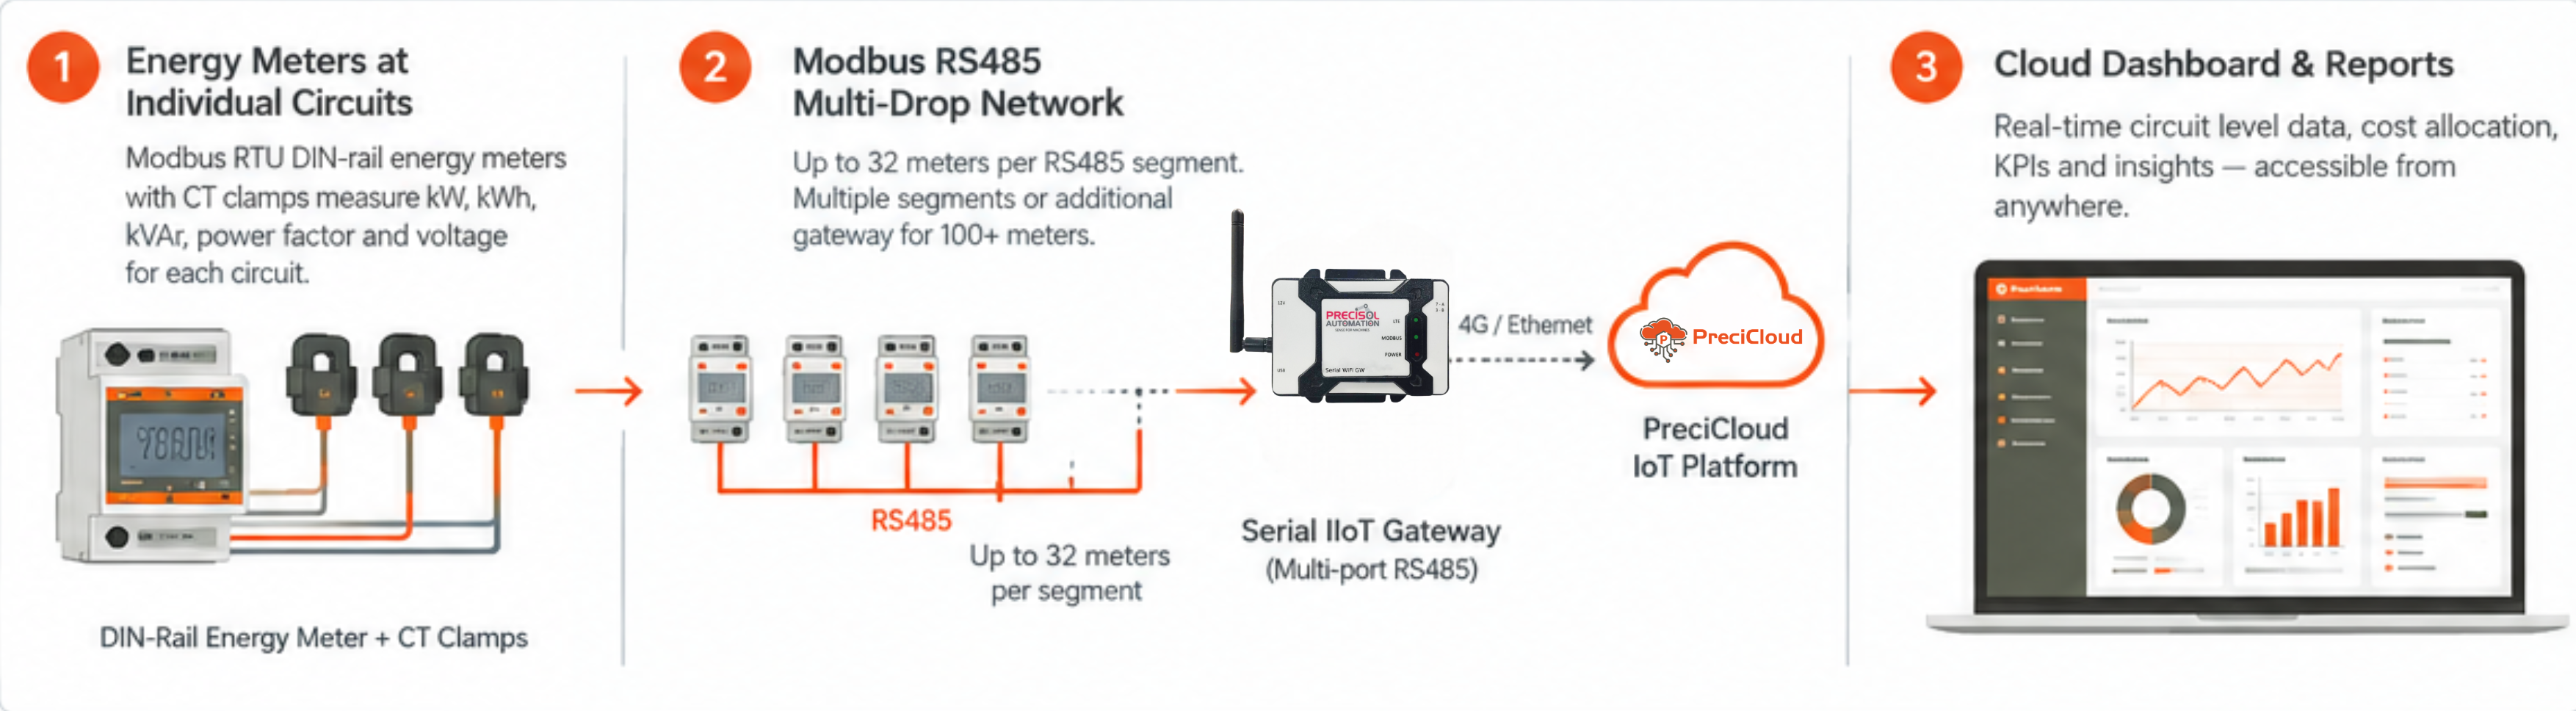
Industrial sub-metering IoT provides the granular, circuit-level energy consumption data that transforms vague energy reduction targets ('reduce energy by 15%') into specific, actionable improvement projects with measurable baselines. A facility's utility meter shows total consumption — useful for tracking the overall bill, but useless for identifying where the energy goes. Energy sub-metering industrial deploys Modbus energy meters on individual circuits: each production machine, each compressed air compressor, each HVAC unit, each lighting zone gets its own meter — and a circuit level energy monitoring IIoT gateway aggregates all readings to a cloud dashboard that shows energy consumption at whatever level of granularity the facility needs. This data unlocks three types of industrial energy value: energy cost allocation IoT allocates actual energy costs to the departments, products, or cost centres that use them — creating accountability and internal pricing signals that drive behaviour change; waste identification reveals the specific machines, circuits, or time periods where energy is consumed with no productive output (idle machines, compressors running during shutdowns, overnight HVAC left on); and efficiency benchmarking shows kWh per unit produced for each machine and production line, enabling performance comparison across shifts, lines, and sites. Industrial sub-metering IoT is the data foundation required for ISO 50001 energy management system certification — the standard explicitly requires energy baseline measurement and metering at significant energy use (SEU) level.
How Industrial Sub-Metering IoT Works
- DIN-Rail Energy Meters with CT Clamps: The physical hardware of energy sub-metering industrial is a Modbus RTU DIN-rail energy meter with split-core current transformer (CT) inputs that clamp around existing cables without circuit interruption. Circuit level energy monitoring meters are installed in main distribution boards or sub-panels during a brief planned outage (for CT installation on the cable), then run permanently measuring kW, kVAr, kWh, power factor, and voltage for their assigned circuit.
- Modbus RS485 Multi-Drop Network: Up to 32 Modbus RTU energy meters share a single RS485 bus to an IIoT gateway — industrial sub-metering IoT deployments with 100+ meters use multiple RS485 segments on a single gateway with a multi-port RS485 interface, or a second gateway for additional meter groups. The gateway polls all meters at configurable intervals (typically 1–15 minutes for trend data) and forwards readings to the cloud platform.
- Energy Cost Allocation IoT Reports: The cloud industrial sub-metering IoT platform correlates circuit-level kWh data with electricity tariff structure (peak, off-peak, demand charge periods) to produce actual energy cost per machine, department, or product — not just kWh, but currency cost at the applicable tariff rate. Energy cost allocation IoT reports are the primary output consumed by production management, finance, and energy management teams.
- Industrial Energy Monitoring KPIs: Key industrial energy monitoring KPIs from sub-metering include: specific energy consumption (kWh/tonne, kWh/unit produced); energy intensity ratio (energy per revenue or production output); baseline deviation (% above or below established energy baseline at the same production volume); and idle/standby energy ratio (energy consumed outside production hours as % of total).
Industrial Sub-Metering IoT: Common Monitoring Points
| Monitoring Point | Circuit Level Energy Monitoring Insight | Energy Cost Allocation IoT Use |
|---|---|---|
| Production Machine (each) | kWh per production cycle; idle vs. running energy; efficiency trend | Machine-level product energy cost; maintenance efficiency indicator |
| Compressed Air Compressors | Compressor runtime %; idle vs. production period energy; leak loss quantification | Compressed air energy cost as % of total production energy |
| HVAC Zones | Heating/cooling energy by zone; outside-hours HVAC waste; seasonal trends | Facility overhead energy allocation by department or area |
| Lighting Circuits | Outside-hours lighting waste; LED upgrade baseline and savings measurement | Industrial energy monitoring for lighting reduction ROI validation |
| Utility Sub-Panels (per building) | Total energy by building or wing; shift-level comparison; demand peak analysis | Energy sub-metering industrial for multi-building campus cost allocation |
Deploy Industrial Sub-Metering IoT with Precisol Automation
Precisol Automation's Serial IIoT Gateway provides the Modbus RS485 multi-drop master interface for industrial sub-metering IoT — polling up to 32 DIN-rail energy meters per RS485 segment and forwarding circuit level energy monitoring data to the cloud. The PreciCloud IoT Cloud Dashboard hosts the energy sub-metering industrial platform with machine-level consumption displays, energy cost allocation IoT reporting, baseline deviation tracking, and industrial energy monitoring KPI dashboards for ISO 50001 energy management compliance.
See IoT energy monitoring delivering facility cost reduction in our IT-OT bridge for process automation case study, or explore how Precisol's smart energy metering application integrates industrial sub-metering IoT data into complete energy management workflows.
Frequently Asked Questions
What is industrial sub-metering IoT and why does it matter?
Industrial sub-metering IoT deploys energy meters at individual machine, circuit, or department level — providing the granular consumption data that utility meters cannot. Energy sub-metering industrial enables energy cost allocation IoT across departments and products, identifies waste from idle machines and outside-hours consumption, and establishes the baselines required for ISO 50001 energy management. Circuit level energy monitoring makes the specific improvements for targeted energy reduction visible — you can only optimise what you can measure.
How does circuit level energy monitoring work in an industrial facility?
Circuit level energy monitoring uses DIN-rail Modbus RTU energy meters with split-core CT clamps installed on circuit breakers in distribution boards — measuring kW, kVAr, kWh, and power factor per circuit without interrupting supply. An IIoT gateway polls all meters via RS485 Modbus bus (up to 32 meters per segment) and forwards industrial sub-metering IoT data to cloud platforms for energy cost allocation IoT reports and energy sub-metering industrial dashboards.
What energy cost allocation IoT insights can sub-metering provide?
Energy cost allocation IoT from industrial sub-metering IoT provides: product-level energy cost (kWh per unit from circuit level energy monitoring correlated with production counts), department energy charge-back, shift-level energy efficiency comparison, machine baseline versus actual energy per cycle, and idle/standby energy waste identification. Industrial energy monitoring KPIs from sub-metering include specific energy consumption, energy intensity ratio, and baseline deviation — all required for ISO 50001 energy management certification.