OEE Monitoring with IIoT: Achieving Overall Equipment Effectiveness
29 July 2026
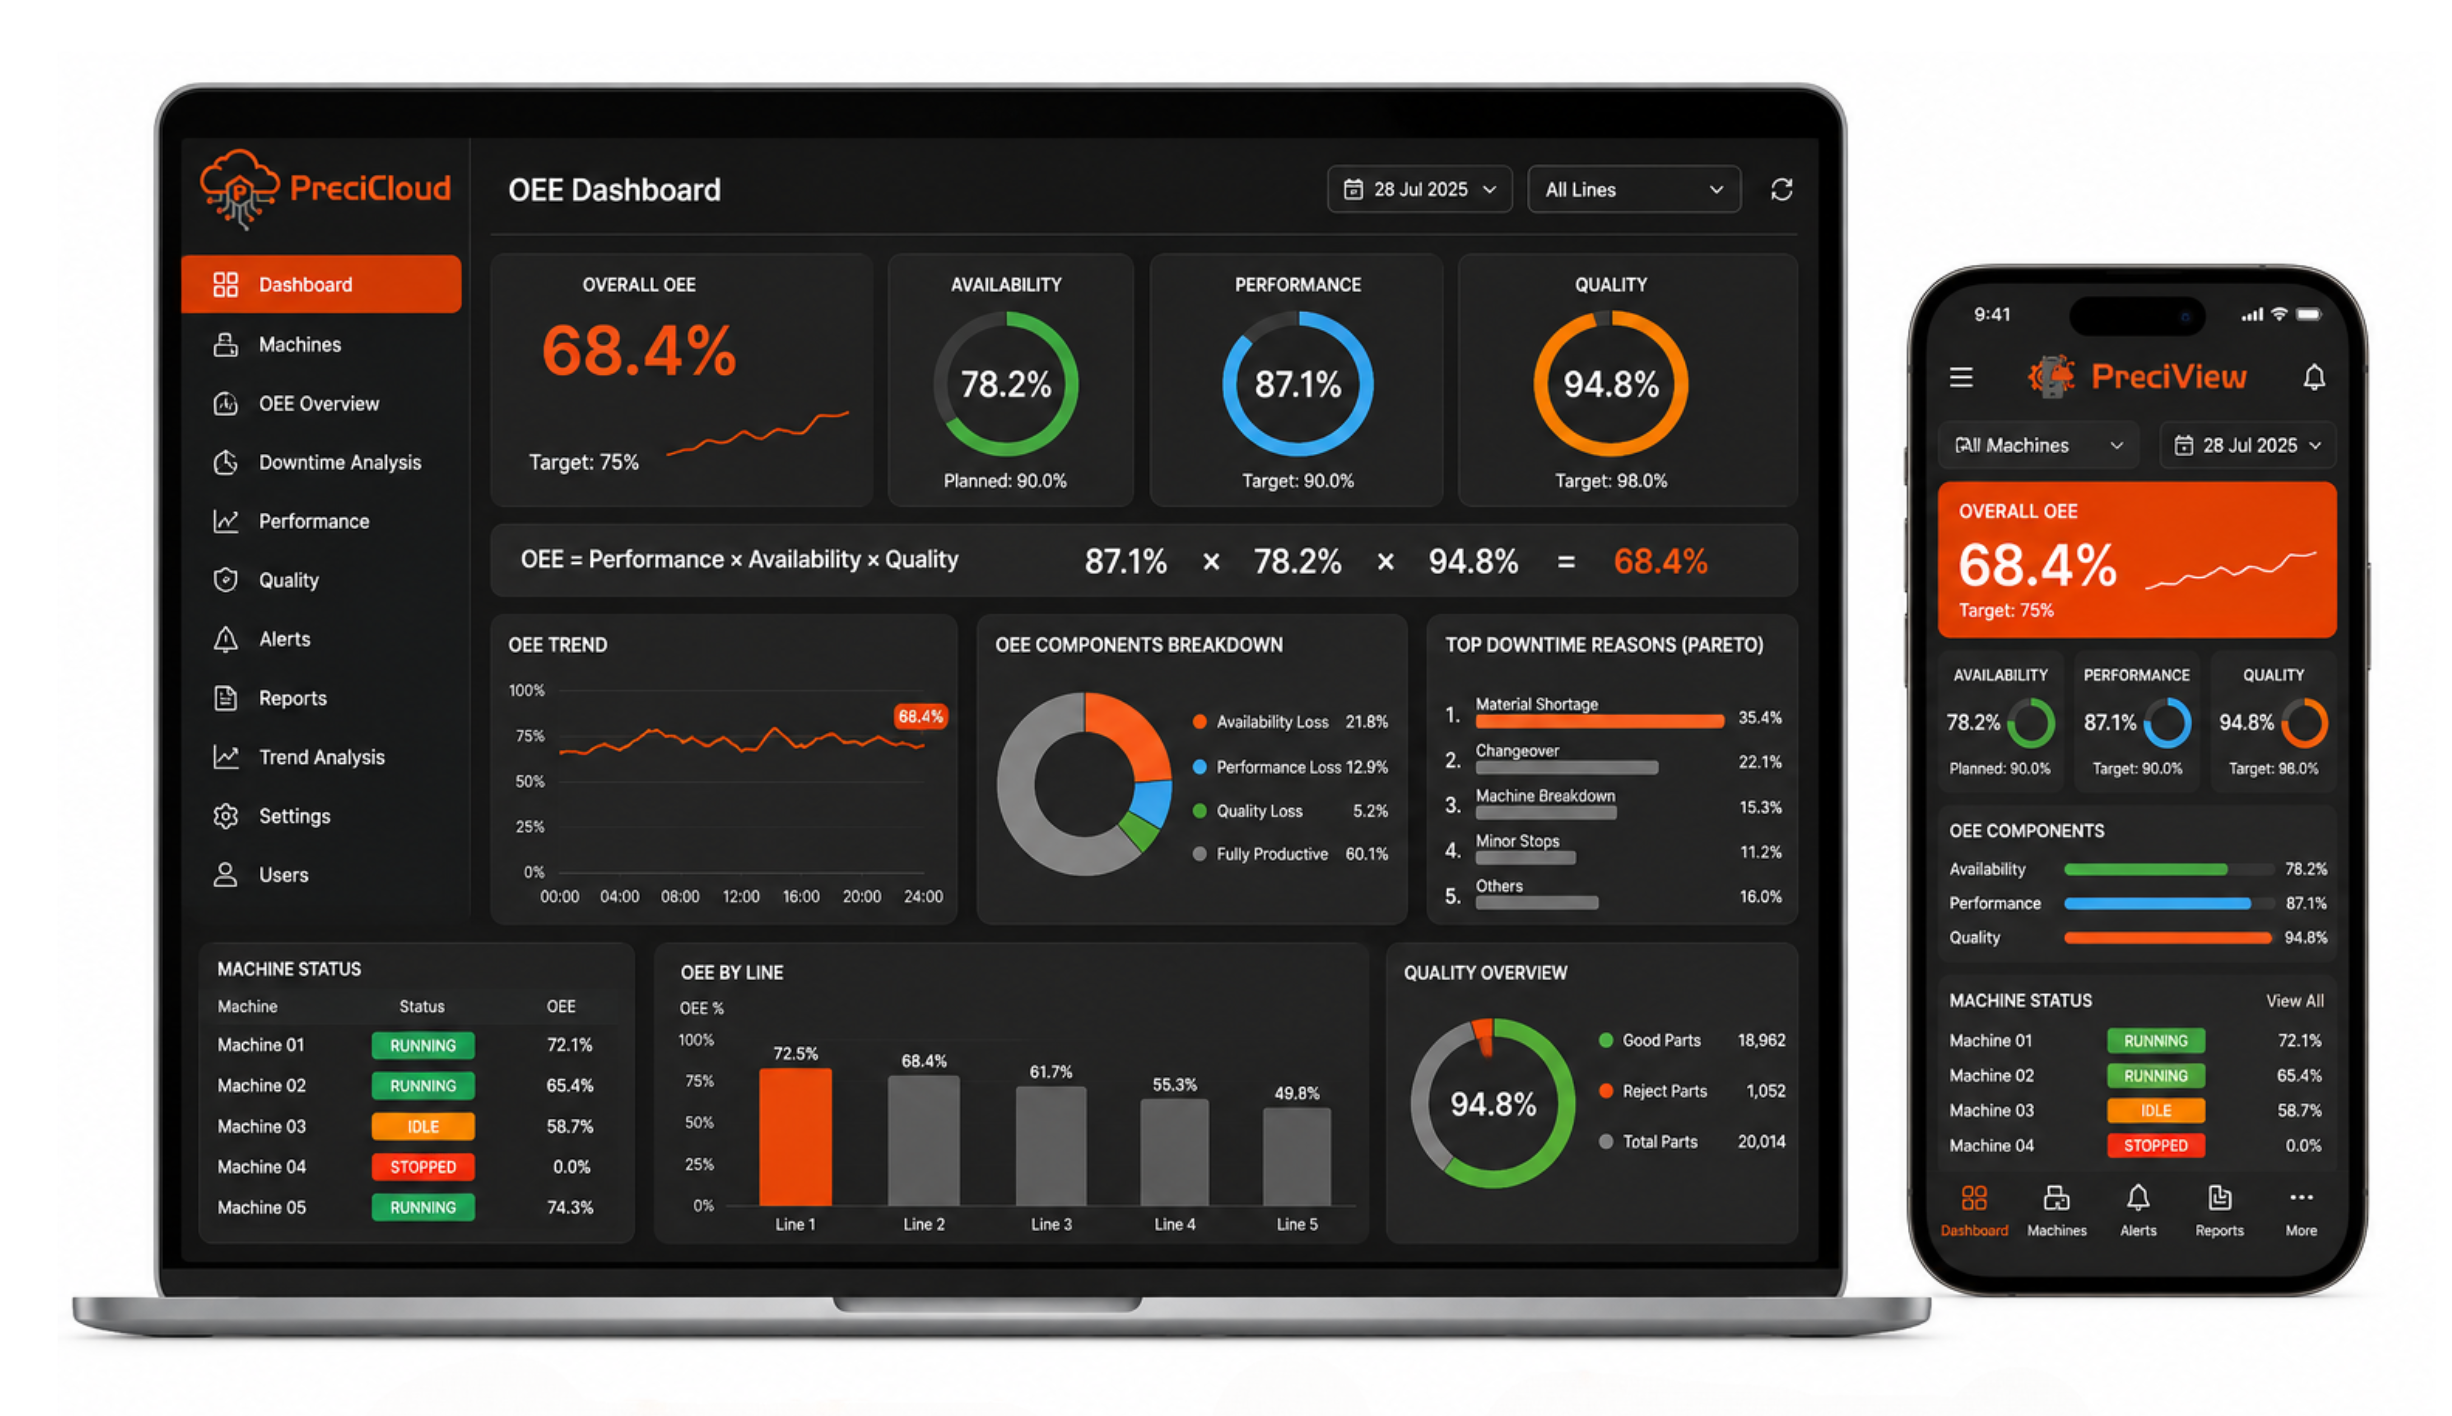
OEE monitoring — tracking overall equipment effectiveness with IIoT technology — is the most powerful tool available to manufacturing operations teams for identifying and eliminating hidden production losses. OEE monitoring measures how effectively a production machine is being used compared to its theoretical maximum by combining three factors: Availability (was the machine running when scheduled?), Performance (was it running at rated speed?), and Quality (did it produce good parts?). The product of these three factors — Availability × Performance × Quality — is the overall equipment effectiveness score. Manufacturing efficiency IIoT transforms OEE monitoring from a weekly or daily manual calculation exercise into a continuous, real-time production KPI tracking system that updates every cycle and surfaces losses immediately on a factory performance metrics dashboard, enabling supervisors and operators to respond to problems within the shift rather than discovering them the following day.
The Three OEE Factors and What IIoT Measures for Each
Understanding how manufacturing efficiency IIoT feeds each component of OEE monitoring is the first step in designing an effective production KPI tracking system:
- Availability (Planned Time − Downtime / Planned Time): The OEE monitoring system detects machine state in real time via a digital input from the machine's run/stop signal or via power monitoring. Every state transition — start, stop, alarm — is time-stamped automatically. Manufacturing efficiency IIoT eliminates the manual stop-logging that typically under-records short stops, which are the most significant hidden availability loss in most plants.
- Performance (Actual Speed / Rated Speed): A production counter (parts counter or cycle signal) connected to the IIoT gateway allows the OEE monitoring system to calculate actual cycle time versus the ideal cycle time for that product. The factory performance metrics system flags micro-stoppages (stops under 5 minutes) and speed loss automatically — losses that are invisible in manual reporting.
- Quality (Good Parts / Total Parts): Quality data feeds into production KPI tracking from in-line sensors or machine reject counters. The manufacturing efficiency IIoT system correlates quality drops with specific machine states, time periods, or operator shifts — making the root cause of quality losses visible in the OEE monitoring dashboard.
OEE Monitoring Benchmarks and What They Mean
| OEE Monitoring Score | Overall Equipment Effectiveness Assessment | Manufacturing Efficiency IIoT Priority |
|---|---|---|
| < 40% | Significant losses — immediate action required | Focus production KPI tracking on availability losses first |
| 40–60% | Typical starting point for plants new to OEE monitoring | Manufacturing efficiency IIoT reveals hidden losses quickly |
| 60–75% | Acceptable but significant improvement potential | Factory performance metrics analysis to identify top loss categories |
| 75–85% | Good performance — world-class target approaching | Granular production KPI tracking to find remaining losses |
| > 85% | World-class overall equipment effectiveness | Sustaining OEE monitoring and benchmarking across machines |
Building a Factory Performance Metrics Dashboard
An effective OEE monitoring dashboard presents factory performance metrics at the level needed for each audience: real-time machine OEE for operators and line supervisors; shift and daily summaries for production managers; weekly and trend data for plant management. Key production KPI tracking elements on the manufacturing efficiency IIoT dashboard include: real-time OEE per machine and production line; Pareto analysis of downtime reasons (automatically ranked by duration); availability loss breakdown by shift, day, and stop category; performance loss trending to identify speed degradation patterns; and quality loss correlation with time, product, and operator. OEE monitoring platforms that display these factory performance metrics on plant-floor screens visible to operators during production drive the fastest improvement — teams act on losses they can see in real time.
Implement OEE Monitoring with Precisol Automation
Precisol Automation's PreciView IoT Monitoring Application provides a complete OEE monitoring and factory performance metrics dashboard — connecting machine signals, production counters, and sensor data into a unified manufacturing efficiency IIoT platform. The PreciCloud IoT Cloud Dashboard enables multi-site overall equipment effectiveness comparison and production KPI tracking across plants.
See OEE monitoring driving measurable productivity improvement in our predictive maintenance in carbon manufacturing case study, or explore how Precisol supports proactive maintenance of construction equipment with factory performance metrics and condition monitoring integration.
Frequently Asked Questions
What is OEE and how is it calculated?
OEE monitoring measures overall equipment effectiveness as Availability × Performance × Quality. Availability tracks uptime vs planned time; performance tracks actual vs rated speed; quality tracks good parts vs total output. Manufacturing efficiency IIoT systems calculate OEE automatically from real-time production KPI tracking — eliminating manual shift reports and revealing hidden losses in each factory performance metrics component.
How does IIoT improve OEE monitoring?
Manufacturing efficiency IIoT replaces manual, shift-report OEE calculation with continuous automated data collection from machine signals and sensors. OEE monitoring updates in real time on factory performance metrics dashboards — enabling intra-shift intervention on availability, performance, and quality losses rather than post-shift analysis. Production KPI tracking accuracy improves dramatically versus manual logging.
What is a good OEE score for manufacturing?
A world-class overall equipment effectiveness score is 85%. Most plants starting OEE monitoring find initial scores of 40–60%. Manufacturing efficiency IIoT that enables real-time production KPI tracking typically drives 10–20 percentage point OEE improvements within the first year, as factory performance metrics make losses visible and actionable at shift level.